2. Differential Expression Analysis
2.1 Construction of expression matrix
2.1.1 HTSeq
Given a file with aligned sequencing reads(.sam/.bam) and a list of genomic features(.gtf), a common task is to count how many reads map to each feature(gene).
Usage
htseq-count [options] <alignment_files> <gff_file>
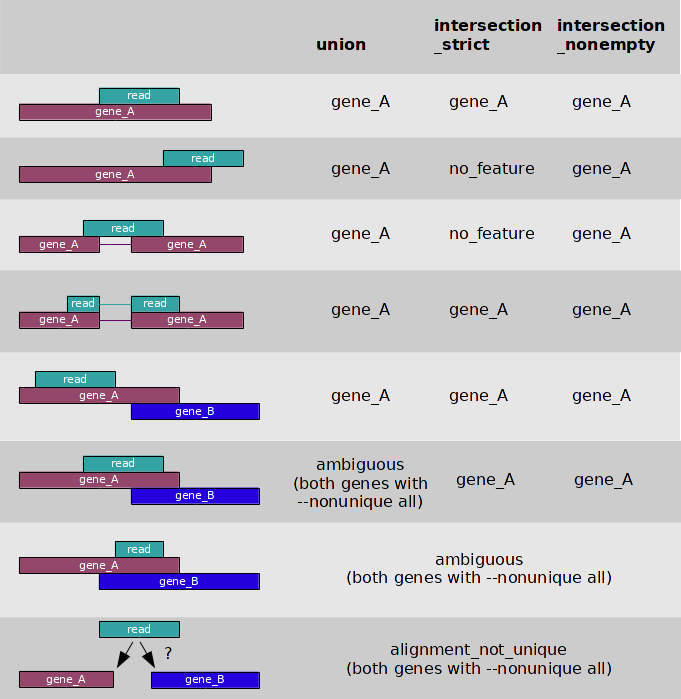
- 3 overlap resolution models
- We shared our snakemake package used for exRNA-seq expression matrix construction.Github.
Tips
- --nonunique
- --nonunique none (default): the read (or read pair) is counted as ambiguous and not counted for any features. Also, if the read (or read pair) aligns to more than one location in the reference, it is scored as alignment_not_unique.
- --nonunique all: the read (or read pair) is counted as ambiguous and is also counted in all features to which it was assigned. Also, if the read (or read pair) aligns to more than one location in the reference, it is scored as alignment_not_unique and also separately for each location.
- Notice that when using --nonunique all the sum of all counts will not be equal to the number of reads (or read pairs), because those with multiple alignments or overlaps get scored multiple times.
Notes
- -m/--mode {mode}
- --nonunique={none/all}
- -s/--stranded {yes/no/reverse}.
- -a {minaqual}.
- -t/--type {feature type}. (defult: exon)
- -i/--idattr {id attribute}, GFF attribute to be used as feature ID. (defult: gene_id)
2.1.2 featureCounts
Usage
Summarize a BAM format dataset:
featureCounts -t exon -g gene_id -a annotation.gtf -o counts.txt mapping_results_SE.bam
Summarize multiple datasets at the same time:
featureCounts -t exon -g gene_id -a annotation.gtf -o counts.txt library1.bam library2.bam library3.bam
Tips
By default, featureCounts does not count reads overlapping with more than one feature. Users can use the -O option to instruct featureCounts to count such reads (they will be assigned to all their overlapping features or meta-features).
2.2 Filter out lower-expressed genes
Purpose
Filtering low-expression genes improved DEG detection sensitivity.
Methods
- Filter the genes with a total counts < = threshold;
- Filter genes with maximum normalized counts across all samples < = threshold;
- Filter genes with mean normalized counts across all samples < = threshold.
Criteria
Retain genes: (Reads >= 1 counts) >= 20% samples.
2.3 Normalization
Systematic biases
Size factor & global-scale normalization

Notes
Marie-Agnès Dillies, et al. A comprehensive evaluation of normalization methods for Illumina high-throughput RNA sequencing data analysis. Briefings in Bioinformatics, Volume 14, Issue 6, 1 November 2013, Pages 671–683 link
Catalina A Vallejos, et al. Normalizing single-cell RNA sequencing data: challenges and opportunities. Nature Methods volume 14, pages 565–571 link
2.4 Commonly used tools
2.4.1 DESeq2
The package DESeq2 provides methods to test for differential expression by use of negative binomial generalized linear models
Usage
> dds <- DESeqDataSetFromMatrix(countData = cts,
                              colData = coldata,
                              design= ~ batch + condition)
> dds <- DESeq(dds)
> resultsNames(dds) # lists the coefficients
> res <- results(dds, name="condition_trt_vs_untrt")
# or to shrink log fold changes association with condition:
> res <- lfcShrink(dds, coef="condition_trt_vs_untrt")
Tips
Analyzing RNA-seq data with DESeq2
Notes
We shared scripts on github.
- DESeq2 normalization: R package DESeq2.Github.
2.4.2 edgeR
Usage
> x <- read.delim("TableOfCounts.txt",row.names="Symbol")
> group <- factor(c(1,1,2,2))
> y <- DGEList(counts=x,group=group)
> y <- calcNormFactors(y)
> design <- model.matrix(~group)
> y <- estimateDisp(y,design)
To perform quasi-likelihood F-tests:
> fit <- glmQLFit(y,design)
> qlf <- glmQLFTest(fit,coef=2)
> topTags(qlf)
To perform likelihood ratio tests:
> fit <- glmFit(y,design)
> lrt <- glmLRT(fit,coef=2)
> topTags(lrt)
Notes
We shared scripts on github.
- TMM normalization: R package edgeR.Github.
2.4.3 RPM
Usage
- normalize the reads by library size (edgeR)
- identify differential expressed gene using wilcoxon.test()
We shared scripts on github.
- RPM normalization: R package edgeR to calculate RPM, then test by R function wilcoxon.test().Github.
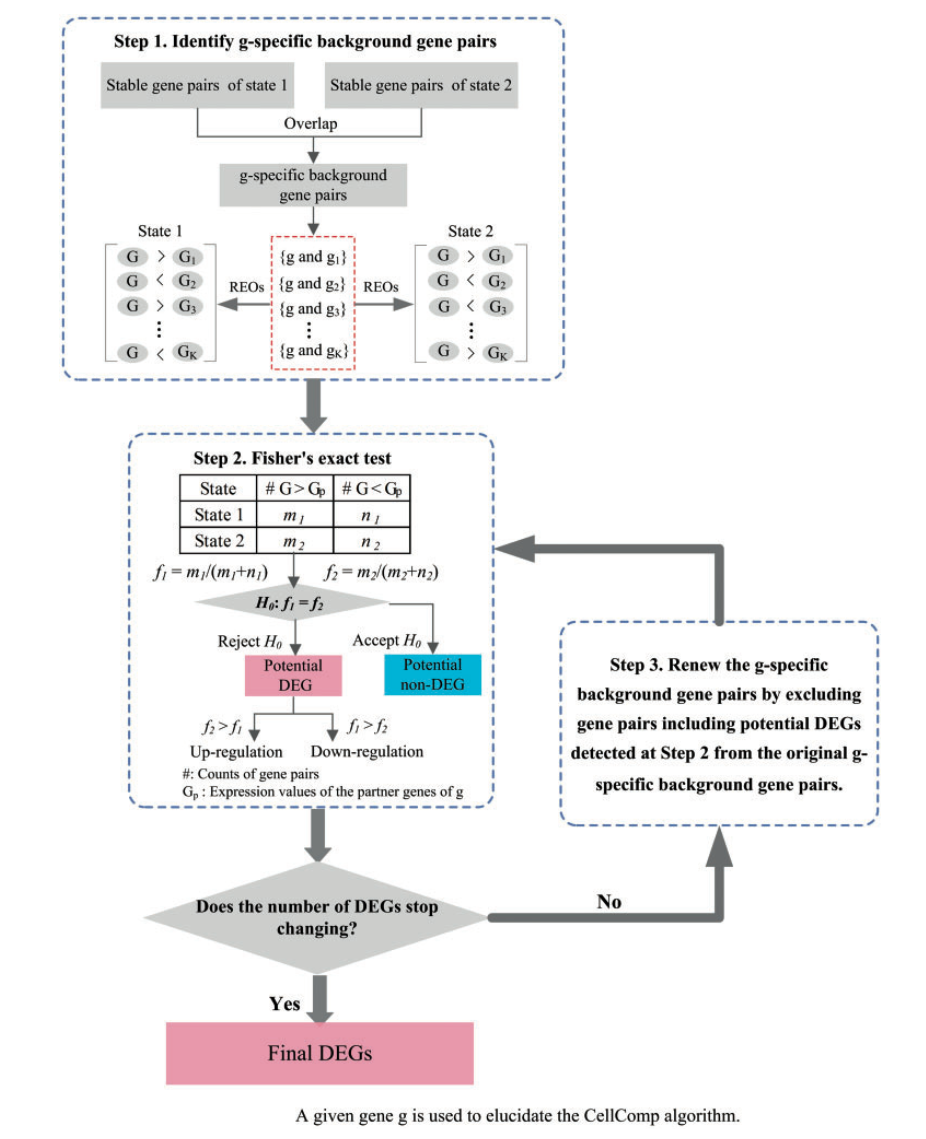
2.5 Optional: rank-based methods
X Li, et al. A rank-based algorithm of differential expression
analysis for small cell line data with statistical control. Briefings in Bioinformatics, 2017, 1–10 link
2.6 Homeworks
Level I: learn how to calculate differential expression
Level II:
- compare the difference between HTSeq and featureCounts
- compare the results of differential expression, draw venn plot to show the difference.
Level III:
- Try to run rank-based method on our data.
- Try to implement the methods using R/Python.